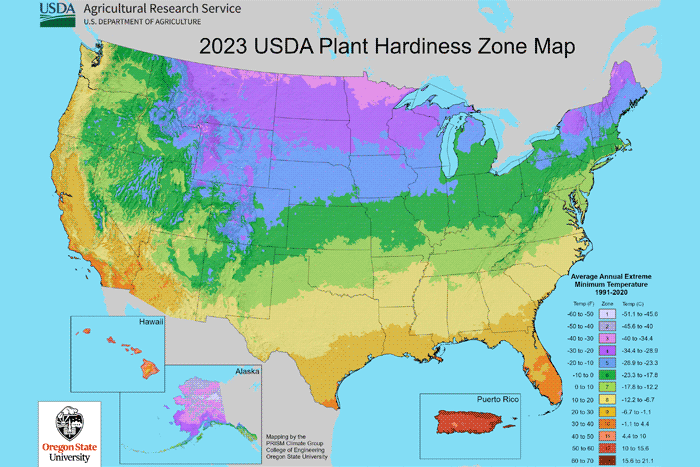
The United States Department of Agriculture, Washington, D.C., released an updated version of its plant hardiness zone map.
The map was developed in conjunction with Oregon State University’s Prism Climate Group and the USDA’s Agricultural Research Service. The previous iteration of the map was released in January 2012. Notably, the new plant hardiness map incorporates data from 13,412 weather stations, compared to the 7,983 that were used for the 2012 map.
“The addition of many new stations and more sophisticated mapping techniques using the latest Prism technology led to a more accurate and detailed Plant Hardiness Zone Map but also produced localized changes that are not climate-related,” says Christopher Daly, director of the Prism Climate Group and the map’s lead author.
The map is divided into 13 zones, each zone representing a 10-degree Fahrenheit range of temperatures. Each zone is further divided into two half zones, with each of those representing a 5-degree range.
“Overall, the 2023 map is about 2.5 degrees warmer than the 2012 map across the conterminous United States,” says Daly. “This translated into about half of the country shifting to a warmer 5-degree half zone, and half remaining in the same half zone. The central plains and Midwest generally warmed the most, with the southwestern U.S. warming very little.”